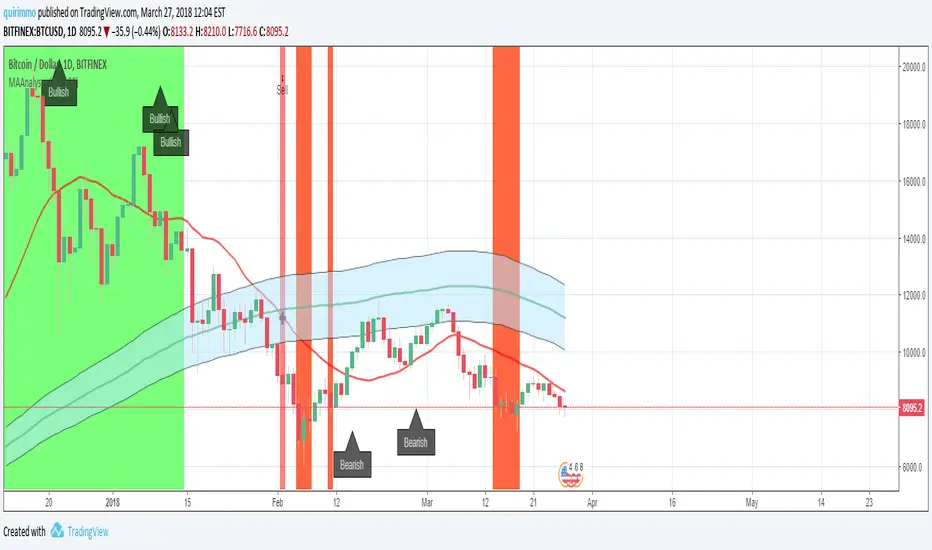
Hull MAThis Hull MA uses the default settings of the built-in MA. The basic idea is that we are in a buy setup when hull is below price, and a sell setup when hull is above price. The indicator is extended with slightly change in contrast when moving average is declining and it plot the ma/price crossovers: green dot when a buy setup is appearing, and red dot when a sell setup is forming. It is possible to hide crossovers in the option panel.
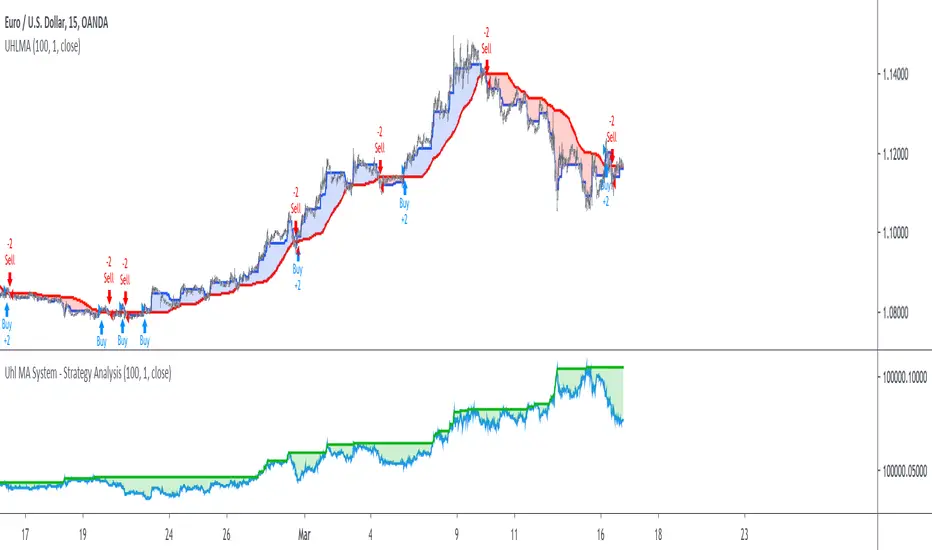
Three alert conditions is added "Hull MA cross", "Hull MA sell" and "Hull MA buy". I use "Hull MA cross" on slow frames (2w, M) and "Hull MA buy/sell" on faster frames.
Penunjuk Pine Script®